Average temperature of Burlington, VT through time
The yearly average temperature in Burlington, Vermont was roughly constant until 1990, since which it has risen by about by more than 1 degree (°C) in the last 30 years
Data Description: The data used in this analysis come from the U.S. National Centers for Environmental Information (NCEI) Climate at a Glance program, which makes monthly temperature and precipitation data from across the contiguous U.S. available to the public to aid in recording and studying climate variability. Monthly data are computed from daily observations made by 344 climate divisions across the contiguous United States. Data for Burlington, Vermont are collected at 44.483333, -73.183333 (station ID: USW00014742). Air temperature data are available in units of degrees Fahrenheit and are collected using an Automated Surface Observing System (ASOS) hygrothermometer.
Data Citation: NOAA National Centers for Environmental information, Climate at a Glance: City Time Series, published August 2023, retrieved on September 6, 2023 from https://www.ncei.noaa.gov/access/monitoring/climate-at-a-glance/city/time-series
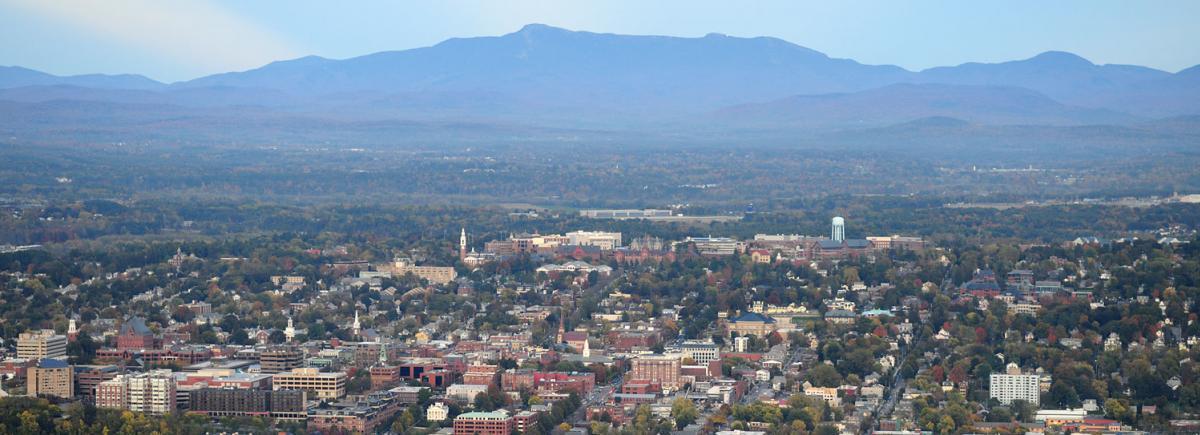
Site Description Burlington is the largest and most populous city in the state of Vermont and is situated in the ancestral homeland of the Abenaki and Wabenaki peoples. It is located on the eastern shore of Lake Champlain in Chittenden County. Burlington experiences hot and humid summers and cold winters.